


|
|
![]()
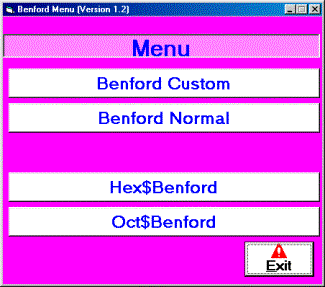
Clicking on the appropriate section by mouse will bring you to the required menu, if you click on the exit , then you quit the program.
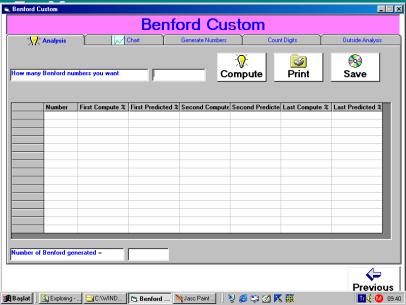
You fill in the prompt : “How many Benford numbers you want =” .
The minimum amount that a Benford effect may show up is about “5.000” numbers in a set. If you enter “10.000” or more numbers you’ll get better and better results. After click on “compute” icon, another prompt will show up as the following.
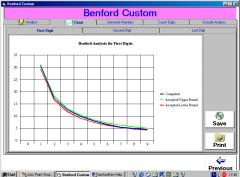
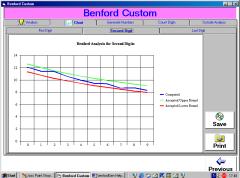
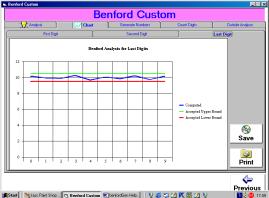
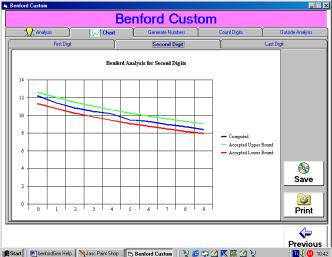
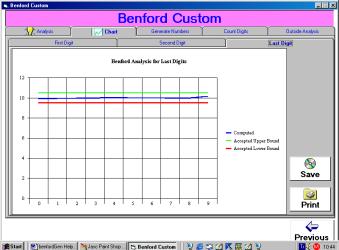
If you enter chart submenu, then you may be able to see the charts drawn for the first second and last digits. The acceptable upper and lower bounds for the Benford analysis is also given, so that if you exceed the required limits you can startup the process from the very beginning by increasing the number in the set until you reach an acceptable list in the Benford analysis.
Attention;
The “number set generated” in this analysis submenu is “NOT” written to any file , but it only gives you some idea about the generating of benford sets. You can only save the “analysis results” or “charts” to the appropriate file.
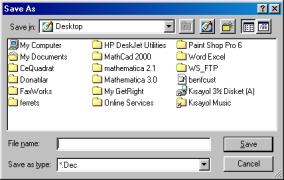
In this section you write the numbers generated to a file with the extension “dec”. This “dec” type of file comes from the word “decimal” ands spans all the numbers that are decimal (there are other type of files “hex” for Hexadecimal and “oct” for Octal type of numbers in the other sections).Everything is like the analysis section “Except” after the end of custom box filling, prompt for saving file is opened. The chart section is not operative in the generate numbers submenu, since this submenu only generates and writes a Benford set to a “dec” file.
This submenu, counts the digit percentage in a dec file. It counts the percentage of the file immediately after generation or count digit percentage of a certain file by open command at any time . It can also Save or print the contents of any opened file.
“outside analysis”
You may open an outside file with “dec” extension and an analysis begins immediately after the file is opened . The results are seen as in the analysis section and they may also be saved and printed. The charts section is operative in this submenu just like the pure analysis section at the beginning.
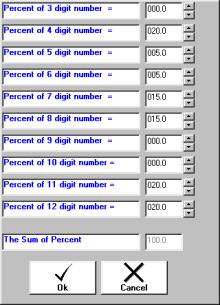
The only difference in this menu is the input prompt, as you see; the min. and max. number of digits are stated and you may adjust the number of “min and max digits” by clicking the “arrows” or “entering” their respective values to the inputs.
Examples;
-----------------------------------------------------------------------
Min digits =5
Max digits =9
Means that, there’ll be ;
5 digit numbers, consisting “about” %20 of all numbers
6 digit numbers, consisting “about” %20 of all numbers
7 digit numbers, consisting “about” %20 of all numbers
8 digit numbers, consisting “about” %20 of all numbers
9 digit numbers, consisting “about” %20 of all numbers
-----------------------------------------------------------------------
Min digits =3
Max digits =5
Means that, there’ll be ;
3 digit numbers, consisting “about” %33.3 of all numbers
4 digit numbers, consisting “about” %33.3 of all numbers
5 digit numbers, consisting “about” %33.3 of all numbers
-----------------------------------------------------------------------
Min digits =5
Max digits =5
Means that, there’ll be only ;
5 digit numbers, consisting %100 of all numbers
-----------------------------------------------------------------------
If you want to get a different digital percent ; let’s say
3 digit numbers % 50
4 digit numbers % 15
5 digit numbers % 0
6 digit numbers % 35
the other digits being all % 0
--------------------------------------------
adding up to %100
You should certainly use BenfordCustom menu for this kind of job.
-----------------------------------------------------------------------
In this menu hex numbers are generated or analyzed, however there is no max , min digits or custom prompt choice for input numbers (Min 3 digits “OR” max 7 digits are automatically generated) . You don’t have a control over the digits.
In this menu oct numbers are generated or
analyzed,
There is a max and min digits choice (min 4 digits and max 8 digits) and
you have a full control over the digits
generated or analyzed.
While computing the numbers in a set, sometimes the numbers are discarded by the program and you get less numbers than you have proposed, BUT this is not a very important aspect since this condition does not exceed about 1/1000 in proportion.
Examples;
When you require “10.000” numbers in a set, you receive a set of
“9.995” numbers. If you want to be so exact then just write 10.005
numbers to the input prompt, to receive 10.002
OR 10.000 numbers at the output.
Suppose we don’t want to write the Benford set to any file, but only want to make an analysis to see the general performance of the software. We choose the analysis section of (Custom, Normal, Hex$ or Oct$) choices. In here we choose the analysis submenu.of the main Custom menu. Since we don’t have to write all the Benford set to a file then we don’t consider the length of any file and we may input a number of 50.000 “or more” to the input prompt to so see the overall performance of the software.
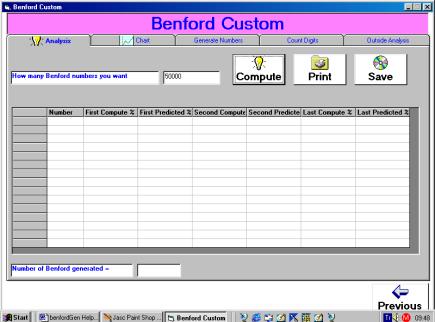
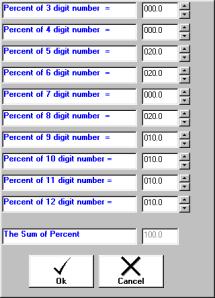
As you see, we input 50000 to the input prompt. Next we click “compute” and we’ll get the following screen. Then we make the custom arrangements as shown. Please note that “the sum of percent is =100.00” or else we’ll meet with an error message.
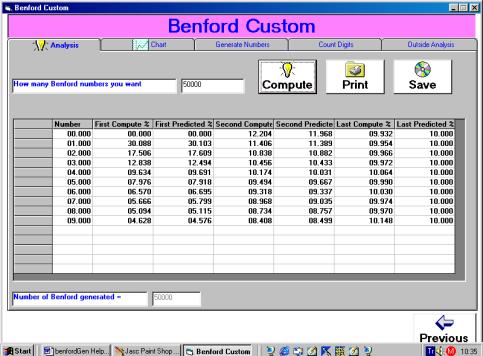
after clicking “OK” the computation begins, at the end of about 15 minutes the calculation stops and we have the following screen shot.
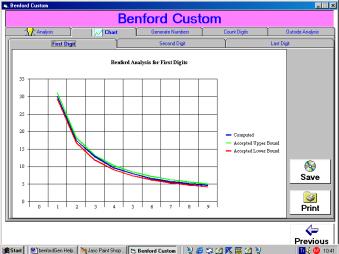
In this submenu part, the “chart section” is operational and We’ll see the following screen shots for first, second and last digits.
In this submenu the “count digits“ section is inoperative, since we didn’t save our “Benford set” to any file. The charts and analysis summary may be saved and printed as you click the appropriate areas in the screen.
In this tutorial we are going to produce a realistic example of the monthly sales of a hypermart which sells merchandise goods from pencils to excavators and from cars to houses. The produced monthly sales figures will be as much closer to the reality as possible, so that we can make an exact mathematical model of the accounting datas. The monthly sales figures will be saved in a file called “martsales.dec” . The cents will be separated by a dot (.)
Assumptions:
From our past experience we know that the the percentage figures of the sales of such a hypermart will be approximately as follows;
3 digit numbers % 37.0
4 digit numbers % 30.0
5 digit numbers % 20.0
6 digit numbers % 8.0
7 digit numbers % 3.0
8 digit numbers % 1.0
9 digit numbers % 0.7
10 digit numbers % 0.2
11 digit numbers % 0.1
12 digit numbers % 0.0
------------------------------------
totals %100.0
For this kind of a generation, obviously we are not going to use normal distribution , since in that case the sales figures of pencils and cars will be the same which is not so realistic, therefore we are going to use custom menu for the generation. There’ll be 7000 entries in our example.
1-Click Benford Custom.
2-Click generate numbers.
3-Fill The prompt “How many Benford numbers you want=” prompt as “7000”
4-Check “delimiting character dot (.)”
5-Click compute.
6-When custom table pops up, change the custom table as following.
3 digit numbers
% 37.0
4 digit numbers
% 30.0
5 digit numbers
% 20.0
6 digit numbers
% 8.0
7 digit numbers
% 3.0
8 digit numbers
% 1.0
9 digit numbers
% 0.7
10
digit numbers %
0.2
11
digit numbers %
0.1
12
digit numbers %
0.0
------------------------------------
totals
%100.0
7-When “Save as” menu appears write “martsales” as the name. “.dec” extension will be automatically given.
8-Click “Save”
9-After 20 seconds, your file is ready in the directory you want.
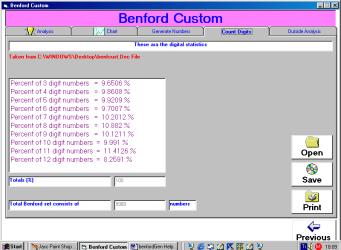
10-Click “count digits” you’ll meet with the following table
Taken
from C:\WINDOWS\Desktop\martsales.Dec File
Percent
of 3 digit numbers = 36.1532 %
Percent
of 4 digit numbers = 30.3944 %
Percent
of 5 digit numbers = 19.9628 %
Percent
of 6 digit numbers = 8.6882 %
Percent
of 7 digit numbers = 2.7865 %
Percent
of 8 digit numbers = 1.0432 %
Percent
of 9 digit numbers = .7716 %
Percent
of 10 digit numbers = .1286 %
Percent
of 11 digit numbers = .0714 %
Percent
of 12 digit numbers = 0 %
-----------------------------------------------------------------------------
Totals
(%)99.9999
Total
Benford set consists of 6998 numbers
Please note that there are “6998” numbers in the file, instead of “7000”. That means the software has rejected 2 of the numbers It has created. The percentages of the files have been changed a little bit, instead of “%36” which you want, it gave “%36.1532” as the final. Since the end results are not so much different than the ones we proposed, we accept this “count digits” table.
11-Save this table as “martsalesD” . “.txt” extension will be automatically given.
12-Click “outside analysis”
13-open the file “martsales”
14-After the analysis is finished (which will take a couple of minutes) Save this analysis summary as “martsalesA” ”.txt” extension will be given automatically given.
15-Click “Chart”
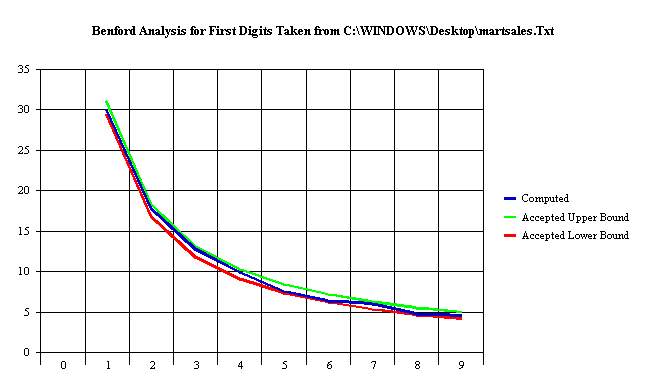
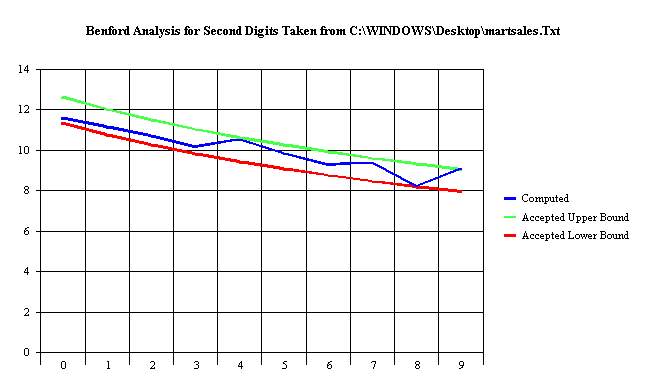
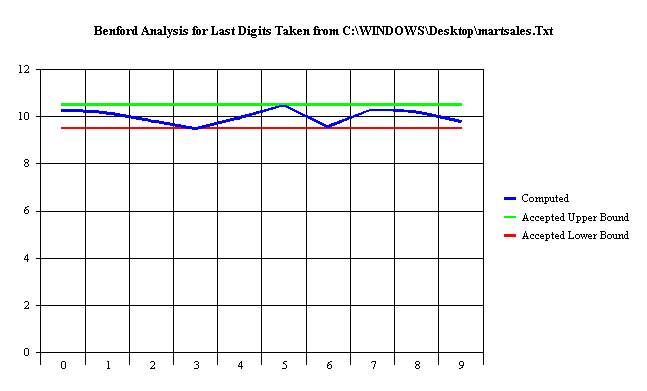
16-Save “first digit” , “second digit” , “last digit” as “martfirstdig” ,
“martsecdig” , “martlastdig” respectively.
“.bmp” extension will be automatically given. You see from charts that
all the results are between acceptable limits.
Congratulations, you have just finished your first “generation and analysis” of a genuine “Benford set”.
That
means, you have invented a Benford data sheet from nothing.
Please perform this second tutorial, after you
conclude the first one
In this tutorial we are going to produce a realistic example of the annual sales of a real estate company which sells estates from farms to houses and from lands to flats. The produced annual sales figures will be as much closer to the reality as possible, so that we can make an exact mathematical model of the accounting datas. All sales figures will be in integers. Number of entries will be “5000”
Assumptions:
From our past experience we know that the the percentage figures of the sales of such an estate company will be approximately as follows;
3 digit numbers % 0.0
4 digit numbers % 0.0
5 digit numbers % 0.0
6 digit numbers % 0.0
7 digit numbers % 0.0
8 digit numbers % 50.0
9 digit numbers % 30.0
10 digit numbers % 10.0
11 digit numbers % 8.0
12 digit numbers % 2.0
------------------------------------
totals % 100.0
1-Click Benford Custom.
2-Click generate numbers.
3-Fill The prompt “How many Benford numbers you want=” prompt as “5000”
4-Check “no delimiting character”
5-Click compute.
6-When custom table pops up, change the custom table as following.
3
digit numbers % 0.0
4
digit numbers % 0.0
5 digit numbers
% 0.0
6 digit numbers
% 0.0
7 digit numbers
% 0.0
8 digit numbers
% 50.0
9 digit numbers
% 30.0
10 digit numbers
% 10.0
11 digit numbers
% 8.0
12 digit numbers
% 2.0
------------------------------------
totals
% 100.0
6-Click “OK”
7-When “Save as” menu appears write “estatesales” as the name. “.dec” extension will be automatically given.
8-Click “Save”
9-After 12 seconds, your file is ready in the directory you want.
10-Click “count digits” you’ll meet with the following table
Taken from
C:\WINDOWS\Desktop\estatesales.Dec File
Percent of 3 digit numbers
= 0 %
Percent of 4 digit numbers
= 0 %
Percent of 5 digit numbers
= 0 %
Percent of 6 digit numbers
= 0 %
Percent of 7 digit numbers
= 0 %
Percent of 8 digit numbers
= 49.3496 %
Percent of 9 digit numbers
= 29.2375 %
Percent of 10 digit numbers
= 11.1467 %
Percent of 11 digit numbers
= 8.6052 %
Percent of 12 digit numbers
= 1.661 %
-----------------------------------------------------------------------------
Totals (%)100
Total Benford set consists of
4997 numbers
Now, suppose we didn’t like this “count digits” table, because the last two percentages (11 and 12 digits) doesn’t conform too much with our first assumptions. What should we do ?
Solution;
We see that the 12 digit numbers tends to decrease, while the 11 digit numbers tends to increase. To compensate, we should just do the opposite. Then just fill in the custom table as following.
3
digit numbers % 0.0
4
digit numbers % 0.0
5 digit numbers
% 0.0
6 digit numbers
% 0.0
7 digit numbers
% 0.0
8 digit numbers
% 50.0
9 digit numbers
% 30.0
10 digit numbers
% 10.0
11 digit numbers
% 7.0
(decreased 1 point)
12 digit numbers
% 3.0
(increased 1 point)
------------------------------------
totals
% 100.0
Will give in return;
Taken from
C:\WINDOWS\Desktop\estatesales.Dec File
Percent of 3 digit numbers
= 0 %
Percent of 4 digit numbers
= 0 %
Percent of 5 digit numbers
= 0 %
Percent of 6 digit numbers
= 0 %
Percent of 7 digit numbers
= 0 %
Percent of 8 digit numbers
= 49.98 %
Percent of 9 digit numbers
= 30.3843 %
Percent of 10 digit numbers
= 9.4876 %
Percent of 11 digit numbers
= 8.2266 %
Percent of 12 digit numbers
= 1.9215 %
-----------------------------------------------------------------------------
Totals (%)100
Total Benford set consists of
4996 numbers
Which is much more closer to the custom table we want.
Needless to say that the all charts do confirm the benfords law between upper and lower acceptable limits.
After this, we don’t continue
the rest since it is all the same as “generate number 1 tutorial”.
We have only provided the
files of the “generate number 1 tutorial” with this software.
However If you generate your own tutorials,
in the future you’ll be a better expert in “designing” data
sheets.
In order that “custom percent menu” to work properly please perform the following procedures. Open the “regional settings” from the “control panel” .
click “number” submenu at the top, the window will open as the following ;
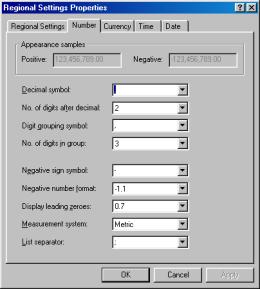
At the top “Decimal
Symbol” prompt, enter dot (.)
instead of comma (,) .
The decimal symbol should be Dot (.) . If you don’t convert
this “decimal symbol” to dot (.)
then you cannot be able to edit
“custom percent” menu in
the software.